We certainly are in an era of disruption. And the threat is definitely real. In a 2013 Oxford University article called ‘The Future of Employment’, Oxford academics predicted 40% of companies will become extinct by 2020.
Well, I’m here not here to alarm you, let me assure you of that. Because, the thing is, any threat is real only until you strategically work out how to deal with it, then it is just the next challenge you embrace. And that is what I am going to help you do.
In their 2016 report “Digital disruption has only just begun” the World Economic Forum reported that digital is the main reason that just over 50% of companies on the Fortune 500 have disappeared since the year 2000.
So, what is digital?
Digital, or rather a digital enterprise, leverages the power of data across mobile, social and cloud-based technologies. The key word here being DATA.
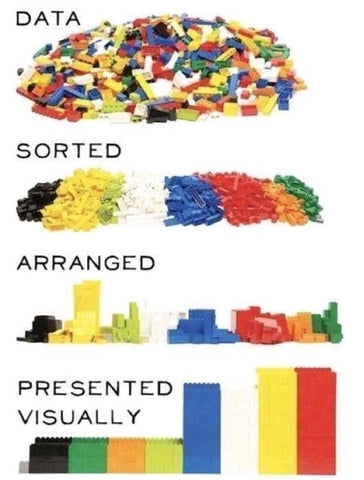
Data on its own is not powerful
The problem with the race for data is that so many go about gathering huge amounts of data, yet data alone is no more powerful than a messed up stack of lego blocks.
In fact, what makes data powerful is what it can tell you, once it’s sorted, arranged and visualised.
For this you need data analytics and there are 4 types your business needs to seize the power in your data and propel business growth. These are:
- Descriptive – to describe what is happening
- Diagnostic – to diagnose (or monitor) for changes
- Predictive – to forecast the likelihood of future outcomes
- Prescriptive – to prescribe opportunities and threats (the most important for propelling growth).
So, before I give you a roadmap for how to become a data-driven business so that you can ride this wave of disruption like the simple wave it is, I will give you some use case examples, to inspire the data-savvy entrepreneur in you to disrupt the disrupters!
Data Analytics Success Stories
Let’s see what successful start-ups know about seizing the power of data that we don’t…
Netflix – Innovation, Customer Experience, Agility and Data-driven strategy…
Netflix had no problems pivoting from mail order DVDs to online streaming (compare this to Kodak’s failure to pivot and innovate). It made this decision after developing insights through tracking consumer behaviour and acting on those insights.
It even uses data in planning the series’ it produces. The hit political drama “House of Cards” was created by analysing consumer habits and tastes, which essentially ensured that the show would be a complete success.
AirBnb – Company-wide Data Literacy
AirBnb are such a huge believer in data literacy that to ensure every team member feels empowered to make data-driven decisions they created a ‘Data University’. Data literacy is the ability to read, work with, understand, and argue about - data. It is as important to 21st Century business as computer literacy was 20 years ago. Not that you have to create a Data University, but getting your staff data literate to drive your data-driven strategy is paramount to your success.
Enough about the big guns now. How about a more detailed summary of how a small e-commerce floral business propelled business growth using analytics.
How did ‘From You Flowers’ use data analytics to boost revenue, increase profits and improve customer satisfaction and retention?
Analytics were applied to 7 areas of their business. This allowed a complete optimisation of operations, advertising, supplier performance and employee rostering.
Prior to analytics function: 10% annual growth from 2002 to 2011
Post analytics function: 30% annual growth from 2012 to 2017
Result: Analytics transformed their performance by drilling down into every area of operation and optimising it for cost efficiency, hidden threats and opportunities, as well as maximising their profits.
The 7 areas they used analytics in were:
-
Improved Service Level Performance – analytics helped them predict their ability to meet customer demands by understanding traffic patterns and average delivery times for each supplier in each city
-
Better Order Fulfilment – analysing supplier performance allowed them to predict which suppliers will give the highest probability of success
-
Improved Supplier Management – analysing customer complaints and refund requests allowed them to drop poor performing suppliers either from on-time or product quality perspective
-
Maximise Customer Value – analytics helped them identity those customers likely to come back so that they could build long-term relationships with them
-
Driving Down Costs – analytics helped significantly improve staffing level forecasts (rostering) which helped manage operational costs
-
Improved Advertising – analytics ensured the best ROI by assessing every advertisement, all website pages, pop-ups, product images and even their location on the website
-
Better Product Management – the data was used to ensure the company targets the right product at the right time, which helps increase sales
Your Map to Propelled Business Growth Using Analytics
As the World Economic Forum states “we need a revolution in skills and a transformation of organisations” if we are to reap the rewards inherent in 21st century opportunity.
So, here is your 4-step Analytics Map to driving value from data.

I hope it adds value to your business!
By ShireWomen Business Member Katrina Kalergis Loukas of Lifehackers Institute.
Lean more about Katrina or get it touch with her by clicking here.